Profit factor explained: what it is, how to calculate it, and what's good
Profit factor is the clearest single number for whether a strategy makes money. The formula, a worked example, and why it says more than win rate.
· 2 min read
Win rate is the stat traders talk about most, and on its own it tells you the least. A 70% win rate can lose money, and a 35% win rate can be excellent. Profit factor is the number that settles it.
The formula
Profit factor = total profit from winning trades ÷ total loss from losing trades
Both numbers are positive. You divide the sum of your winners by the sum of your losers, ignoring the minus sign.
- Above 1.0 means you made money.
- Exactly 1.0 means you broke even.
- Below 1.0 means you lost money.
Use P&L after fees. On micro contracts, fees alone can turn a profit factor of 1.1 into 0.95.
A worked example
Ten trades on MES:
| Trades | Total | |
|---|---|---|
| Winners | 4 | +$520 |
| Losers | 6 | −$360 |
Profit factor = 520 ÷ 360 = 1.44.
The win rate is only 40%, but the strategy makes money. The average winner (+$130) is more than twice the average loser (−$60).
Now the opposite:
| Trades | Total | |
|---|---|---|
| Winners | 7 | +$350 |
| Losers | 3 | −$420 |
That’s a 70% win rate and a profit factor of 350 ÷ 420 = 0.83. Lots of small wins and a few big losses, the classic shape of a trader who moves stops.
Profit factor, win rate and expectancy
These three numbers describe the same trades from different angles:
- Win rate: how often you win.
- Profit factor: how much you win per dollar you lose.
- Expectancy: what you make per trade on average, which is net P&L ÷ number of trades.
Expectancy tells you how much each trade is worth in dollars. Profit factor tells you how robust that is: a profit factor of 1.05 with a positive expectancy is still one bad week away from losing.
What’s a good profit factor?
There’s no universal answer, but as a rough guide for a discretionary day trader after fees:
| Profit factor | What it suggests |
|---|---|
| Below 1.0 | Losing. Find out which setups or mistakes are costing you. |
| 1.0 to 1.3 | Marginal. Fees and a few bad days can wipe it out. |
| 1.3 to 2.0 | Solid, if the sample is large enough. |
| Above 2.0 | Excellent, or a small sample. Check how many trades it’s based on. |
Three ways profit factor misleads
- Small samples. Over 15 trades, one big winner can give a profit factor of 3.0 that means nothing. Look at 50 to 100 trades or more.
- Outliers. A single news-spike winner can hide a losing everyday strategy. Look at profit factor with your biggest winner removed.
- Mixing setups. A profit factor of 1.2 overall can be one setup at 2.0 and another at 0.7. Break it down.
Use it per setup
The real value of profit factor is comparing your setups. If “opening range” has a profit factor of 1.9 over 60 trades and “afternoon fade” is 0.8 over 40, you have your answer about what to stop trading.
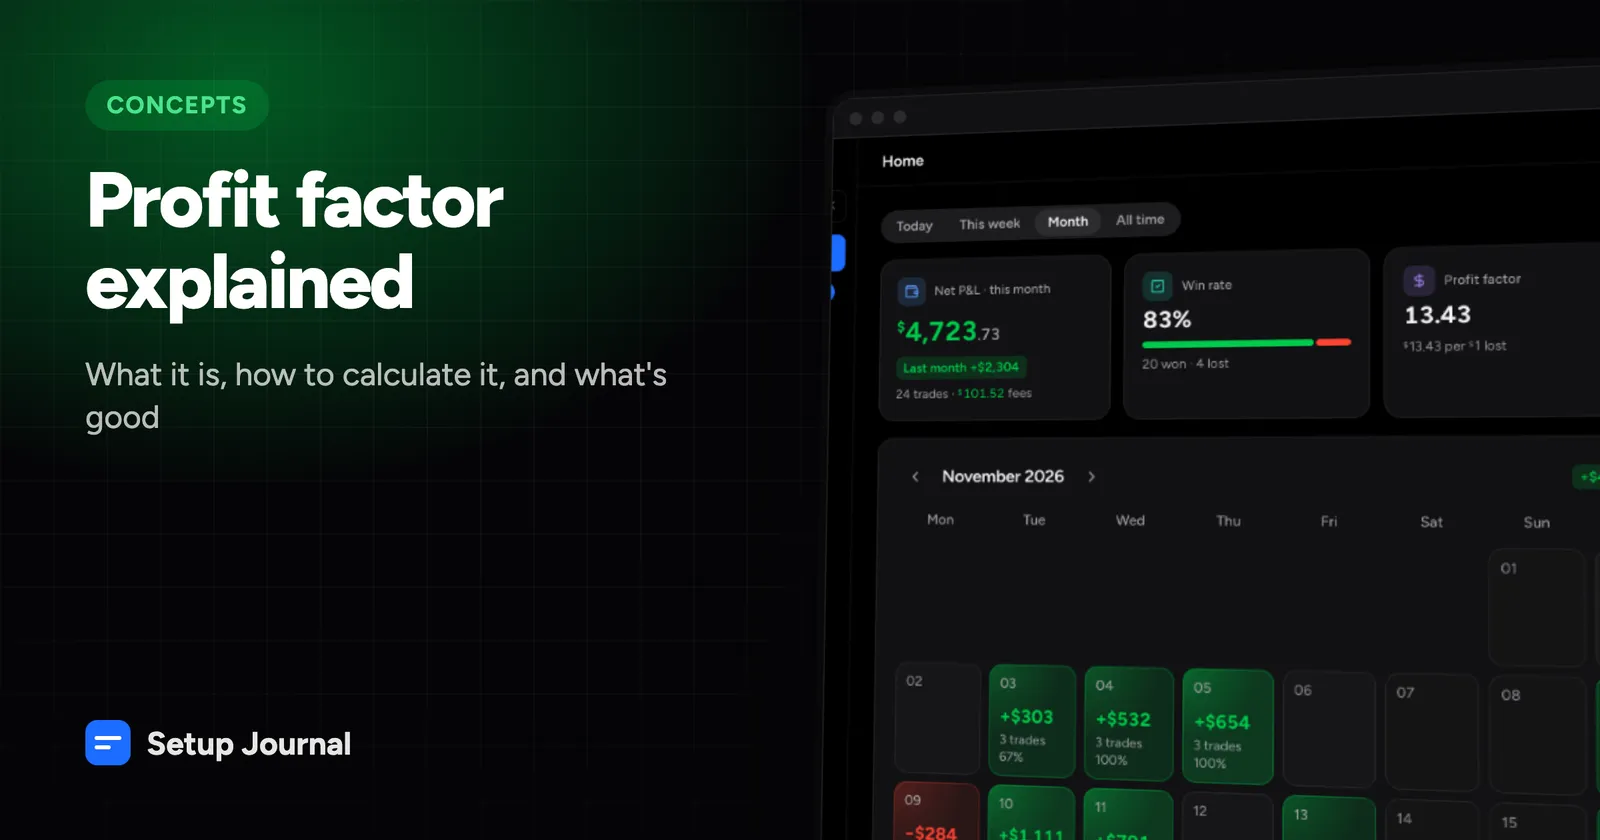
Setup Journal shows profit factor for every period on the dashboard, compares it to the previous period, and breaks P&L down by setup and mistake. Tag your trades as you review them and the numbers build themselves.